
Dynamic Light Scattering (DLS) is a versatile and simple tool used for assessing the colloidal stability of drug candidates early in protein-based therapeutic development.
Like any tool or technology, when you move from theory to practice, questions arise — whether they’re about how to add the tool to a workflow, or what the experimental data tells you about your candidates.
Read on to find the answers to questions your early development scientist peers have asked about how to use DLS to design, select, and advance the most stable biologics candidates.
Find answers to questions about:
- DLS basics
- DLS assay development
- DLS data interpretation
DLS basics: what DLS measures, and what it tells you about your biologics samples
How does DLS work? What information does it give you about your sample?
In a nutshell, DLS works by analyzing the fluctuations in the intensity of scattered light caused by the Brownian motion of particles in solution. The analysis of these fluctuations provides information about the size and size distribution of the particles or aggregates present in a sample.
What colloidal stability parameters does DLS measure?
DLS will give you the size distribution of all the particle sizes present in your sample, and their relative proportions. You’ll also determine the cumulants analysis, which is the average particle size present in the whole sample.
The polydispersity index (PDI) represents the degree of heterogeneity in your sample.
There are many reasons why size information from DLS is useful. It tells you about the stability of your biologic and it shows you the sizes of populations present in your sample, which is a measure of sample quality.
What types and sizes of particles does DLS detect? What is the upper size limit? Does DLS detect sub-visible particles?
DLS measures light scattered from particles that are between 0.5 nm and 1 µm in size. This includes your protein samples, additives like sugars, aggregates, and contaminants like dust.
Anything larger than one micrometer in size won’t be picked up by DLS because the scattering is too great. If you’re looking specifically at sub-visible particles, which are 0.1-10 µm, use a different assessment tool.
In the event that DLS reveals a population of larger aggregates of around 1 µm, follow up with a different assessment tool to check whether these are sub-visible particles. Aggregates and subvisible particles are indicators of poor quality, and pose a risk to patient safety when present in a therapeutic formulation.
Additional references on DLS basics:
[15 min video] How biologics teams use DLS to identify leading candidates
[30 min video] DLS easily explained
[ebook] The biologics researcher’s guide to DLS
Assay development: how to set up DLS experiments so you get the information you need
A well-planned experimental approach leads to information you can work with to make decisions about your biologics candidates.
Is there anything special I have to do with my samples to run DLS experiments?
DLS is a flexible tool in that there’s very little that DLS can’t handle. Your sample should have a concentration that’s greater than 0.5 mg/ml, and as long as you have 10 microlitres or slightly less, then DLS will give good quality hydrodynamic radius (rH) and polydispersity index (PDI).
Because of this flexibility, DLS measurements can be taken right from the size exclusion column, so you’ll know how your sample looks right after purification.
Is there a minimum protein concentration required for DLS measurements? Why? What is it?
Yes. There’s a minimum concentration. A sample that’s too dilute won’t scatter enough light, and this impacts the accuracy of results.
Most DLS instruments, including Prometheus Panta, have a minimum concentration of approximately 0.5 mg/ml.
What are some general considerations when planning DLS experiments?
Plan out your experiments well, and know which questions you’ll be answering with DLS results.
When ranking candidates or setting up formulation screens, use Design of Experiment best practices.
Review the target product profile and know any critical process parameters (CPPs) – like PDI and particle size — that affect quality attributes. Examples of CPPs for formulation screens include buffer pH or excipient concentrations that have been defined and need to be accounted for.
When ranking candidates or screening formulations, you’re comparing to a standard or reference — this would be the parent molecule or a baseline buffer condition. Make sure that reference standard is included in the same run, so that your comparisons are valid.
Should I filter my biologics samples before running DLS?
Whether you should filter your samples depends on why you’re running DLS.
For any scenario where you’re assessing quality, such as formulation screens or process development and optimization, run your sample without filtering so you see all the particle populations that are between 0.005 and 1 micron radius.
For situations where you’re focused on accurate and precise data, filtering removes small particles that may interfere with measurement accuracy. If you know those particles will be removed as part of the manufacturing process, it makes sense to evaluate your samples without them.
Keep in mind that sample recovery after filtration isn’t 100%. If you don’t have a lot of sample to begin with, ask yourself if filtering is necessary. As long as you have 10 microlitres (or slightly less) of 0.5 mg/ml sample, you have enough to run a DLS analysis.
Will filtering a biologics sample remove aggregates?
Yes. Filtering your sample will remove the aggregates present at that moment. But if there’s something in your sample that promotes aggregation — whether it’s hydrophobic patches in the protein, or something in the buffer that’s not ideal — more aggregates will form throughout the experiment, even after filtering. Filtering wouldn’t remove thermodynamically- or chemically-driven aggregation.
I suspect DLS is detecting dust in my biologics samples. What should I do?
DLS detects particles between 0.5 nm and 1 µm radius. So yes, DLS will detect dust particles. Keep your samples and reagents covered. Keep plates and capillaries covered and in a drawer. It’s best practice to filter buffers or use freshly opened buffers at the start of any experiment. If you follow laboratory best practices, but you see particles that you suspect are dust, figure out the source — whether it’s protein expression or purification — and adjust processes to prevent the introduction of dust into your sample.
Can I use DLS if my sample is in a buffer containing glycerol? Is there any upper concentration limit?
Yes, DLS works when your samples are in a buffer containing glycerol.
DLS calculations take into account the refractive index of the solution. You’ll need to enter this information along with other parameters before you run your experiment.
The refractive index is calculated based on the concentration of glycerol in solution, so in theory there’s no limit, though in practice most people don’t go above 50% v/v. The reason is that the glycerol might start to ‘dehydrate’ your protein, which would affect the rH.
The refractive index of the solution is required for accurate sizing measurements. Most DLS instruments have a “dictionary” of common buffers and additives, and their contribution to the refractive index, and therefore automatically calculate that before the experiment. Always be sure you’re providing accurate buffer compositions for the most reliable data.
Can I use additives like guanidine hydrochloride (GuHCl) in my DLS experiments? Will GuHCl affect DLS measurements?
Yes, DLS works with samples that contain GuHCl — or other additives — in the buffer. But keep in mind that GuHCl will change the viscosity of your solution, and viscosity information is needed to calculate particle sizes. Your DLS data software will prompt you for that and other information required to calculate particle sizing.
Keep in mind that GuHCl is large enough to show up in your DLS size distribution plot, so don’t be surprised if you see it.
Will detergent micelles or sugars show up in the size distribution plot?
DLS resolves down to around 0.5 nm in size.
Sugars like sucrose are large enough to show up in DLS results.
Detergents on their own are usually smaller than 0.5 nm, so they won’t show up.
Micelles are trickier. If they’re all of a similar size (i.e. monodisperse), you’ll see a relatively high rH peak. But it’s more likely they won’t be monodisperse. And if so, they could show up where you normally see aggregates — and could be interpreted as such. If you’re deliberately prepping your candidate as a micelle, DLS will tell you whether or not you have a uniformly-sized population.
Additional references on DLS assay development:
[15 min video] How biologics teams use DLS to identify leading candidates
[30 min video] DLS easily explained
[ebook] The biologics researcher’s guide to DLS
[DLS instrument] Prometheus Panta for biologics
Data interpretation: what DLS data tells you about your biologics
DLS doesn’t just tell you about the size of the particles in solution. It also tells you how many different sized populations there are, and how uniform in size a given population is.
You’ll use that DLS data to:
- Understand overall sample quality
- Check how many different populations are present in your sample
- See how uniform in size a given population is
- Infer what’s in each population
- Determine whether you have any aggregates
You’ll compare samples to:
- Rank candidates
- Define a formulation that supports candidate stability
- Observe how stress tests and forced degradation studies affect candidate stability
What does ‘good DLS data’ look like?
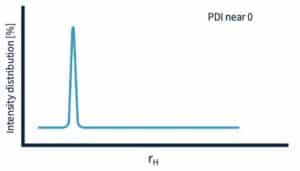
A monodisperse sample has a low PDI value, closer to 0. That is, a sample that contains a single species of protein, well-folded, and isn’t contaminated with aggregates. The size distribution plot peak will be nice and sharp.
What’s the reason for the broader peak in my size distribution plot?

You’ll see a broader peak and a lower height if your protein molecules aren’t uniformly folded. Or when there are multiple species present, but they’re within a few nanometers of each other in size and can’t be resolved as distinct populations by the software. Note that this will also increase the PDI value.
There are multiple peaks in my size distribution plot. What does this mean?
This is best answered with an example.

The size distribution plot above has four distinct populations.
The purple arrow indicates a very low molecular weight particle of around 2 nm radius. A particle of this size could be a sugar, a peptide fragment, a nucleotide, or some other small molecule.
The blue arrow indicates the expected protein peak. But note that the peak is broad, which is indicative of poor stability.
Finally, the black arrows indicate large aggregate clumps.
These multiple populations together are increasing the overall sample PDI, and more importantly, they indicate that you have big problems with your product. A sample with these characteristics needs to be reformulated or thrown out altogether.
My samples have high PDIs OR the size distribution plot has many peaks. Is the data useful? Is my candidate the problem? Is it the buffer? What should I do?
If you see a high PDI, it tells you there’s a problem with your sample. What you do with that information depends on your project and your priorities.
Factors that contribute to a high PDI are multiple populations with different sized species, and broad peaks in the size distribution plot. In practice, a high PDI is almost always because of aggregation. The question is, what’s driving that aggregation? Is your protein unstable? Is there something wrong with its environment?
If most or all samples have high PDIs, then it’s something common to all samples. Depending on what experiment you ran, it could be the protein, the formulation, or the upstream process.
Buffer optimization is usually the go-to approach, especially if you have a construct you’re determined to use, and can’t or don’t want to make changes to its amino acid sequence.
Increasing salt concentrations, adding sugars such as sucrose, or changing the pH — aim for at least one pH unit away from the pI — are typical approaches to stabilizing a protein.
If you’re screening formulations or if only a subset of samples have a high PDI, then check what’s common between them. If possible, remove those common formulation components from consideration and move on. If necessary, adjust the formulation, then test again. To improve stability, consider adding a sugar to the formulation. It’ll form a protective barrier around your protein. And that’ll keep it solubilized — even if it has hydrophobic patches on the edges.
If adjusting the formulation isn’t enough, consider making changes to the candidate protein itself.
If you have the flexibility to do so, consider re-engineering your candidate protein. Use AI models to figure out how to retain binding or activity of your protein without compromising its structure and stability. If an outward-facing hydrophobic patch is contributing to instability, check whether adding a few ionic amino acid side chains will improve stability. Use AI tools to find options, the wisdom of human experience to evaluate, and wet bench work to test.
For some of my samples, instead of data, I get error messages like “Too many outliers” and “Inconsistencies detected”. Why’d I get the error message? What should I do?
Why? You probably have lots of aggregates. Size distribution plots are compilations of multiple DLS scans. In the case of Prometheus Panta, it takes ten scans and layers them on top of each other to give the average size distribution plot. You also have the option to evaluate individual scans. If you have lots of aggregates and they are of multiple different sizes, the software will flag the sample for outliers or inconsistencies.
What should you do? Start by filtering the sample and see if that resolves it. But you’ll still want to know where that aggregation came from in the first place. It could be the buffer, the protein itself, or the expression or purification processes.
Intensity distribution plot vs volume distribution plot: which should I use, and why?
Whether to use intensity or volume distribution depends on what information you seek.

DLS uses intensity to calculate particle size. Since larger particles scatter more light than the same amount of smaller particles, the populations of larger particles will be overrepresented.
On the other hand, volume distribution looks at the volume that’s displaced by the particles. And while this is also weighted in favor of larger particles, it’s less so than for intensity distribution.
As the size of a particle increases, the intensity of the light it scatters increases much more rapidly than its volume.
If you have a sample with large particles like aggregates, and you’re concerned that you won’t be able to see your smaller candidate protein, have a look at the volume distribution. This will also make it easier to see small particle additives.
Of course, remember that comparison of different samples should always be done with the same distribution analysis.
Once you get started using DLS and you learn what the data’s telling you, its versatility, low sample requirements, and reliability will become clear.
The next step is to figure out how best to combine DLS with the other tools in your toolbox. Then it’ll bring even more value to candidate characterization and formulation decisions.
To learn more about DLS and how to add it to your stability characterization toolbox:
[15 min video] How biologics teams use DLS to identify leading candidates
[30 min video] DLS easily explained
[ebook] The biologics researcher’s guide to DLS
Explore NanoTemper’s stability characterization instrument with DLS, nanoDSF, and more:
Prometheus Panta for biologics